Views: 36
The Chinese real economy crushes the West’s hollow service model
Frans Vandenbosch 方腾波 07/09/2026
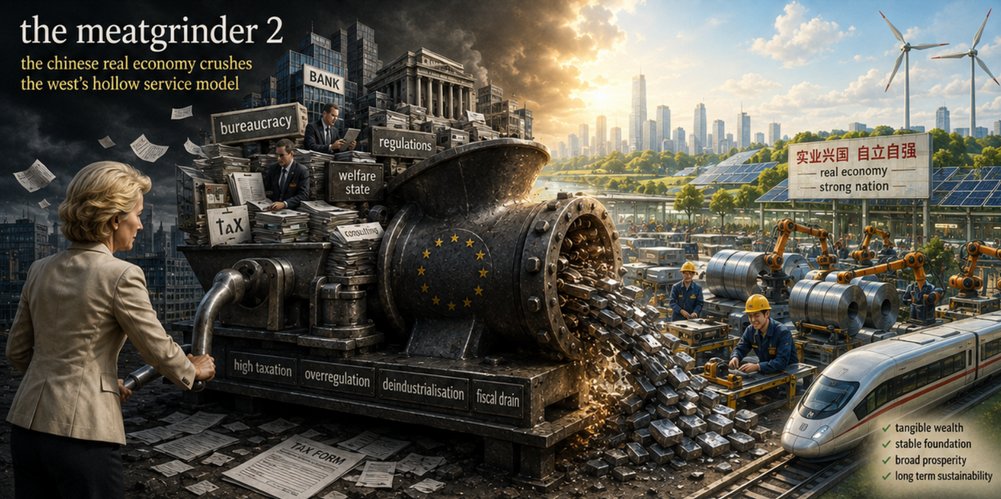
It wasn’t China that built the economic meatgrinder. Von der Leyen’s Brussels built it, feeding the European economy in pieces to please her American masters.
For decades, the post-industrial consensus has held that a vibrant service sector is the hallmark of a developed economy. Yet these employment figures, drawn from my own independent research, turn that assumption on its head. They reveal that the West’s wholesale abandonment of primary and secondary industries has produced a hollowed-out model, while China’s focus on tangible wealth creation offers a far more stable and long time foundation.
It is hardly surprising that Western mainstream media has chosen to bury these findings; the comparative data expose a deeply uncomfortable truth about the fiscal unsustainability and structural fragility of the service-dominated welfare state.
This article is the second in a series of “Meatgrinders”. The first one is here:
https://yellowlion.org/the-meatgrinder-1/ [1]
The cold truth of the figures
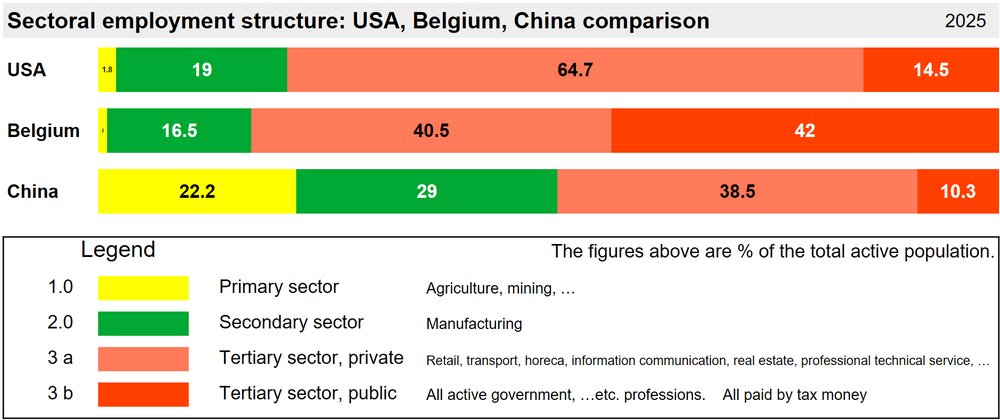
Note on the 42% public sector employment in Belgium:
In Belgium 42% of the active (working) population is directly or indirectly paid by tax money. See the Endnotes for further details.[1]
Some conclusions on three-country employment structure
Primary and secondary sectors are the fundamental wealth foundation of a society.
Primary sectors (agriculture, mining, resource extraction) and secondary manufacturing sectors are the only tangible sectors that create real material wealth for ordinary residents. From the data, China allocates 22% of employment to the primary sector and 29% to the secondary sector, with a combined 51% of the workforce engaged in real wealth-producing industries. By contrast, the United States only has a combined 20.8% and Belgium just 17.5% in these two core lifeline sectors.
The basic wealth creating sectors reveal a critical structural vulnerability in developed Western economies. Their long-term massive outflow of labour from agriculture and manufacturing has weakened their domestic capacity for self-sufficient material supply and endogenous wealth generation. China’s higher employment share in primary and secondary industries is a deliberate structural arrangement that anchors social stability, guarantees basic material supply and distributes tangible wealth broadly among the population, which is far more sustainable than the deindustrialised model adopted by the US and Belgium.
The positioning boundary of the private tertiary service sector must be strictly defined:
The private tertiary sector is essentially just a supporting service industry whose core function is to serve material production and real economic activities. It should not evolve into an independent wealth extraction tool controlled by financial groups.
The United States allows the private tertiary sector to expand to 64.7% of total employment. This oversized service sector includes inflated real estate, finance, speculative information businesses and monopolised professional services, which easily become channels for concentrated wealth accumulation by a small number of capital oligarchs, widening internal income inequality. Belgium’s private tertiary share sits at 40.5%, and a way too fat public tertiary sector, causing heavy taxation, which brings long-term fiscal burdens and low operational efficiency.
China’s private tertiary sector accounts for only 38.5% of employment, a restrained scale that keeps service industries firmly in a supplementary, supportive role for agriculture/mining and manufacturing. This arrangement prevents service industries from decoupling from the real economy and turning into profit-grabbing monopolised sectors, effectively blocking the path for capital oligarchs to reap excessive profits through bloated virtualised services.
China’s prudent control over excessive service sector expansion is a scientifically sound strategic choice:
China has taken the initiative to slow the overexpansion of the tertiary service industry, a policy fully validated by this comparative employment data. Many developed economies blindly pursued service sector expansion in the name of industrial upgrading, leading to industrial hollowing and a weakened wealth creation ability for the society.
By prioritising stable development of primary agricultural and resource industries and solid secondary manufacturing industries, while limiting the disorderly expansion of the private tertiary sector, China locks the main body of wealth creation within material production links that directly benefit ordinary people. Meanwhile, the 10.3% share of tax-funded public tertiary posts maintains a lean and efficient public service team, avoiding the high welfare fiscal drag seen in Belgium’s 42% public tertiary employment ratio and the oligarch-driven distortion of the US oversized private service sector.
Core strategic implication of the structural difference
The comparison makes clear that post-industrial models featuring ultra-high tertiary sector employment are not an inevitable optimal development path. An economy with a large proportion of labour rooted in tangible primary and secondary wealth-producing sectors has stronger anti-risk capacity, more equitable wealth distribution and more resilient long-term development. China’s current employment structure, built on the lifeline of primary and secondary industries with a moderately sized service sector, conforms to the essential law of social wealth creation and represents a far more reliable long-term development framework.
Belgium
Belgium’s oversized tax-funded public tertiary sector and comparative institutional reflections.
The unsustainable fiscal burden imposed by Belgium’s 42% tax-funded workforce on wealth-creating real economy:
Belgium only has 1% employment in the primary sector and 16.5% in the secondary sector, which means merely 17.5% of its working population are engaged in tangible, value-adding production activities that generate real social wealth. Yet 42% of the entire active labour force relies entirely on fiscal tax revenue for salaries and operation costs. All public sector wages, benefits and operational expenses must be squeezed through taxation from the tiny wealth-producing primary and secondary industries, alongside the 40.5% private service sector.
This creates a severely inverted economic burden structure. The small productive real economy bears the heavy fiscal cost of supporting nearly half the working population. To sustain such a bloated public workforce, Belgium has to maintain extremely high personal income tax, corporate tax and social security contribution rates. High taxation directly erodes the profit retention capacity of manufacturing enterprises, suppresses industrial investment willingness, discourages the expansion of material production sectors and further accelerates the shrinkage of its already weak primary and secondary industries. It forms a vicious closed loop: shrinking wealth-creating sectors need higher taxes to fund the oversized public system, and excessive taxation weakens the real economy’s vitality even more.
In sharp contrast, China’s tax-supported public tertiary employment only accounts for 10.3% of the labour force. The 51% combined workforce in primary and secondary wealth-producing sectors easily underwrites the lean, efficient public service team, with minimal tax pressure falling on productive industries. This model protects the profit space of real economy entities and leaves sufficient capital for industrial upgrading, technological research and development and workers’ income growth.
The ironic contrast behind the public sector scale question: who truly practices excessive state-led employment expansion ?
A straightforward numerical comparison delivers a thought-provoking reality. Belgium, a Western capitalist welfare state, has 42% of its working population on the government payroll financed by taxes. China, a socialist country with public ownership as its core institutional foundation, strictly controls tax-funded public employment at only 10.3%.
This data completely breaks the biased Western stereotype that labels socialist systems as synonymous with oversized government, bloated administrative teams and massive state-dependent employment. China adheres to the principle that public institutions should serve the real economy rather than become a bloated burden on it. China streamlines administrative staffing, promotes institutional downsizing and market-oriented operation of public services and limits fiscal-funded posts to essential public governance, basic education, medical care and public security. Meanwhile, Belgium’s ultra-large public sector expansion stems from the long-term political compromise of Western partisan electoral competition. Political parties promise expanded public jobs, generous welfare benefits and guaranteed permanent government positions to win voter support, which leads to the continuous swelling of tax-dependent public employment under capitalist electoral games. The cold figures prove that in terms of restraining the scale of tax-burdened government employees, China’s institutional restraint mechanism is far more prudent and market-friendly to wealth-creating industries.
Who’s the “Communist” country here ? China or Belgium ?
Hidden risks to electoral balance and democratic operation brought by Belgium’s nearly half public-sector workforce
When 42% of the voting-age active population are direct beneficiaries of government fiscal expenditure, inherent structural risks arise for the fairness and balance of its electoral democracy. These public sector employees rely on government fiscal allocation for their core livelihoods including salaries, pension schemes and fringe welfare. Their direct personal interests are closely tied to the continuation and expansion of government budgets, public department scales and high taxation mechanisms.
In electoral voting behaviour, this large group will have strong inherent motivation to consistently support traditional, incumbent parties or political factions that commit to maintaining high public spending, expanding government staffing and protecting public sector welfare benefits. It creates a solid interest-based voting bloc that is inclined to consolidate the existing regime and mainstream ruling parties. Opposing political forces that propose fiscal austerity, public sector downsizing and tax reduction will face great difficulty winning the approval of this massive interest group. Over the long run, the diversity of electoral choices is weakened, policy debates tend to avoid tackling the core problem of oversized public sector fiscal unsustainability and political decision-making becomes trapped in the inertia of maintaining bloated government departments to lock in voting support. This kind of interest-bound voting behaviour deviates from the original intention of rational democratic deliberation and evolves into a self-reinforcing interest cycle that blocks necessary structural economic reforms. China’s small-scale 10.3% public workforce avoids such systemic voting bias risks. Public staff groups are small in proportion and their employment and welfare rules are formulated based on public service demand rather than electoral vote bargaining, ensuring policy formulation can focus on long-term economic development and overall public interests without being constrained by large-scale interest voting blocs.
Belgium at its way for disaster
Belgium’s 42% tax-funded public employment ratio is a product of Western welfare state electoral compromise, which places an unbearable tax burden on its fragile wealth-creating primary and secondary sectors, distorts healthy industrial development and poses potential structural hidden dangers to the impartial operation of its electoral system. The comparative data objectively reflects that China’s restrained, efficiency-oriented public sector scale not only better protects the real economy’s wealth creation capacity but also avoids the interest-driven voting distortions derived from an overexpanded government workforce, representing a more stable and sustainable governance and economic structure.
The Brussels meatgrinder destroying our prosperity
The implications of these figures are stark. Belgium’s tax-funded public sector, swollen to 42% of the workforce, is not a sign of social progress but a fiscal millstone, sustained only by crushing the productive industries that must finance it. America’s private service juggernaut, at nearly two-thirds of employment, has become a vehicle for financial rent-seeking rather than genuine wealth creation. Both models rest on a dangerous fiction: that services can substitute for the tangible output of fields and factories. My research demonstrates otherwise. China’s deliberate retention of a majority of its labour in primary and secondary sectors, paired with a lean public estate and a tightly circumscribed private service sphere, is not a developmental lag but a strategic bulwark. It ensures broad-based material prosperity, insulates the economy from financial shocks and avoids the interest-driven distortions that now paralyse Western governance. These are not abstract academic points; they are hard numbers that Western capitals ignore at their peril. The meatgrinder, it turns out, was of their own making. The data leaves nowhere left to hide.
Thank you for reading! We’d love to hear your thoughts. Please share your comments here below and join the conversation with our readers!
Endnotes
[1] The 42% figure is based on a report of the NBB National Bank of Belgium: Verslag 2014 – “Woord vooraf” (see page 6, lines 181-182) Governor Luc Coene of the NBB wrote there: “De hoge overheidsuitgaven die, zonder de rentelasten, in 2014 ruim 51% bbp beliepen, hinderen de economie in het creëren van banen.” The 42% public employment can be easily derived from that figure.
While Le Vif appears to be the first on 11/04/2015 to publish the damming figure, a few other outlets (Knack, HLN, De Standaard, …) reported on the statistic around the same time, showing it was picked up quickly after the NBB report’s release.
Much later, other research has confirmed the 42% public sector employment figure.
All other figures in the graph are derived from the national accounts and administrative data (e.g., National Bank, social security). Some figures are rounded estimates where precise public/private splits are not published. Classification: The NACE-BEL 2025 nomenclature has been introduced, but the underlying data still largely follows the NACE Rev. 2 structure.